
Amazon Q3 2026 Seller Signals: What the Numbers Mean
A concise seller briefing on Amazon's Q3 2026 unit mix, seller-services growth, advertising growth, and the account checks that matter.

Muhammed Nasser
November 5, 2026
Amazon's Q3 2026 results show third-party sellers remain central to marketplace volume while seller-services and advertising revenue continue to grow. The figures are useful context, but they do not forecast an individual account. Sellers should use them to sharpen decisions about contribution margin, inventory, and advertising.
Read the three seller-relevant Q3 signals in context

Amazon reported third-party seller services revenue of $46.492 billion in Q3 2026, up 9% year over year and 10% excluding foreign exchange. Third-party sellers represented 61% of worldwide paid units, excluding Whole Foods Market. Advertising services revenue reached $19.637 billion, up 11% year over year and 12% excluding foreign exchange.
The official table also shows advertising growth excluding foreign exchange slowing from 26% in Q2 to 12% in Q3, while seller-services growth moved from 16% to 10%. Amazon notes that Prime Day timing shifted between 2025 and 2026, which complicates direct comparisons. The correct takeaway is directional: sellers remain structurally important, but aggregate rates are benchmarks for questions rather than account targets.
Translate corporate growth into account-level checks

Compare like-for-like periods and separate event weeks from ordinary weeks. Review whether ordered units, net sales, and contribution profit moved together. Check organic versus paid sales, campaign incrementality, fee and fulfillment changes, returns, inventory availability, delivery speed, listing conversion, and review trends.
Amazon's company results cannot explain a weak ASIN. Before using an external trend as the reason, test catalog quality, price, availability, traffic quality, offer competitiveness, and customer experience inside the account.
Build a Q4 decision dashboard for margin, inventory, and ads
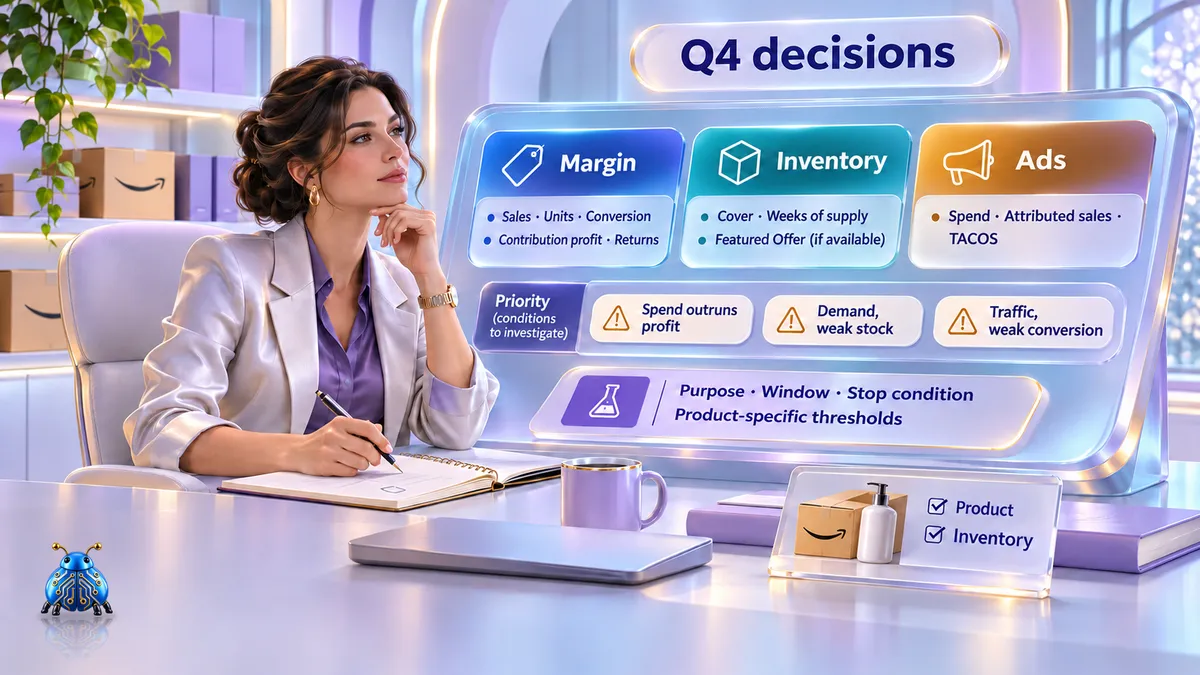
Flag products where paid spend rises faster than contribution profit, items with healthy demand but weak availability, and listings with adequate traffic but falling conversion. Set thresholds from each product's economics. Every test should have a purpose, a measurement window, and a stop condition.
FAQ
No. It is the share of worldwide paid units attributed to third-party sellers, excluding Whole Foods Market. It is not revenue, gross merchandise value, or profit share.
No. Amazon reports advertising-services revenue, not seller campaign effectiveness. Account-level efficiency must be measured with incremental contribution profit and related operating data.
Only when their own margin, inventory, conversion, and incrementality evidence supports the change.
Conclusion
Amazon's Q3 figures confirm the continuing importance of third-party sellers and paid visibility. Their best use is to prompt an account-level review of profitable growth, not to supply a forecast.
Sources
1 refrences
Ready to Take the Next Step?
Bluebug helps marketplace teams connect advertising, listings, reviews, and operating data to decisions that protect profitable growth.
Keep reading

Walmart Holiday Shopping Trends 2026: Seller Decisions
A concise seller guide to Walmart's 2026 holiday research on value, shopping timing, and AI-assisted discovery.

Amazon Customized FBA Return Grading: A Seller Setup Guide
A concise guide to customized grading rules, evidence-based criteria, and controlled pilots for FBA Grade and Resell.

Walmart Automotive Catalog Changes: Prepare for January 2027
A concise checklist for Walmart automotive product-type changes, deprecated mappings, and feed testing before January 2027.